Updated 7 August 2023 (c) 2023
Introduction
Radiometric dating is the most common type of technique employed by researchers to reckon dates for the geologic eras and individual specimens or layers. Radiometric dating is rooted in the rates of radioactive decay of various isotopes, which rates have been measured carefully in numerous laboratories beginning in the early 20th century. Radioactive decay is in turn a very basic physical phenomenon, well understood as a consequence of quantum mechanics. Quantum mechanics is one of two cornerstones of modern physics (the other is general relativity), and has been precisely confirmed in thousands of very exacting experiments. For these reasons, scientists have considerable confidence in these dates when they are measured properly in accordance with procedures that have been developed and refined over several decades.
Some of the most commonly used radiometric schemes are [Dalrymple1991, pg. 111; Dalrymple2004, pg. 55]:
- Argon-argon
- Lead-lead
- Lutetium-hafnium
- Potassium-argon
- Rhenium-osmium
- Rubidium-strontium
- Samarium-neodymium
- Uranium-lead
- Uranium-thorium
Each method has its own particular range of applicability, which derives from the half-life of the particular radioactive decay involved. Uranium-thorium dating, for instance, can be used to date specimens up to about 500,000 years old (since the half-life of the U-Th decay is 75,000 years), but Rubidium-Strontium dating can be used to date specimens billions of years old (since the half-life of the Rb-Sr decay is 48.8 billion years).
Technical details
The following is a brief technical description of how scientists determine dates with radiometric schemes. This section may be omitted if readers do not wish to follow the math (although the math used here is nothing beyond what is typically taught in a good high-school math analysis class).
In mathematical terms, radioactive decay is governed by a simple exponential formula, taught in many high school math classes:
P1 = P0 e-L t
where e = 2.71828… is the well-known math constant, P0 is the original amount of the radioactive material, P1 is the amount after time t, and L is the decay constant for the radioactive isotope. This decay constant L can be expressed in terms of the half life T (the time it takes for one-half of the material to decay) as L = log(2) / T, where log(2) = 0.693147… is the base-e logarithm of 2. In other words, if we know P1 and P0, or even merely their ratio, we can solve the above equation for the time t. However, usually it is not possible to apply this formula directly, because, for instance, in many cases we do not know the original amount of the radioactive isotope when the rock was solidified. Also, such a calculation does not provide us with any statistical error margin to double-check the result.
Fortunately, scientists have developed several methods that not only circumvent the difficulty of not knowing the original amounts, but also provide a very reliable means of statistical validity checking. For example, the rubidium-strontium isochron method, one of the most widely used schemes, is based on the radioactive decay of rubidium-87 into strontium-87 by the emission of a high-energy electron. The half-life T of this decay has been measured in careful laboratory measurements as T = 48.8 billion years. On the other hand, strontium-86 is a stable isotope. By some simple algebraic manipulation of the basic radioactivity formula above, one can show that the following formula must hold at any time t:
(Sr87/Sr86)t = (Sr87/Sr86)0 + (eL t – 1)
(Rb87/Sr86)t,
where (Sr87/Sr86)t is the ratio of the amounts of these two elements in the sample material after time t; (Sr87/Sr86)0 is the same ratio at time = 0; and (Rb87/Sr86)t is the ratio of these two isotopes at time t. Note that this equation is in the simple form y = b + m x, namely the formula for graph of a straight line with slope m and with y-intercept b: here y = (Sr87/Sr86)t, b = (Sr87/Sr86)0, m = (eL t – 1) and x = (Rb87/Sr86)t. If all we have is one data point, the formula above doesn’t help much more than the original formula. But if we have multiple data points — multiple measurements of different samples say within a single igneous rock, then these should all lie on a straight line, whose slope m is simply related to the age of the specimen by the formula m = eL t – 1. Note that it doesn’t matter that we don’t know the original ratio (Sr87/Sr86)0; instead, this original ratio actually comes out as a result of the calculation!
Isochron graphs
As mentioned above, the isochron dating method boils down to plotting multiple data points, after some calculation, on a graph, which, if the measurements and calculations are done properly, should lie on a straight line, or very nearly on a straight line. The slope of this line, after another simple calculation, then gives the age.
Of course, in real scientific research, scientists do not rely on manually drawing points on graph paper to determine a best-fit straight line or to determine the line’s slope or y-intercept. Instead, they use a statistical technique known as linear regression, which computes the least-squares best fit of a straight line through a sequence of points. This technique, which is used in virtually all disciplines of modern social science, physical science and engineering, is entirely straightforward, and computer software is widely available to do the requisite calculations and, in fact, is built in to most spreadsheet programs. An important fact is that linear regression, in addition to giving the best fit of the slope of the line (which then leads immediately to the date), also gives a statistical confidence interval as to the possible error in the determination of the slope. Details about linear regression are available in any elementary statistics book, or online — see [Linear2013].
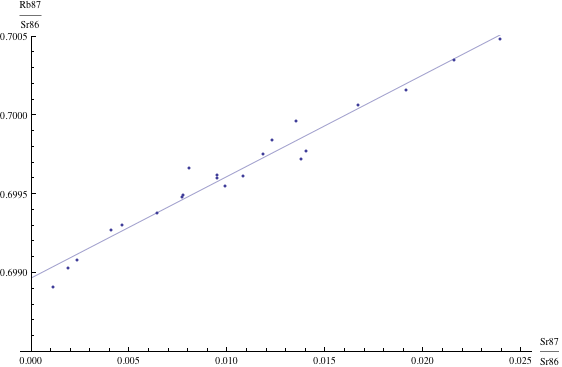
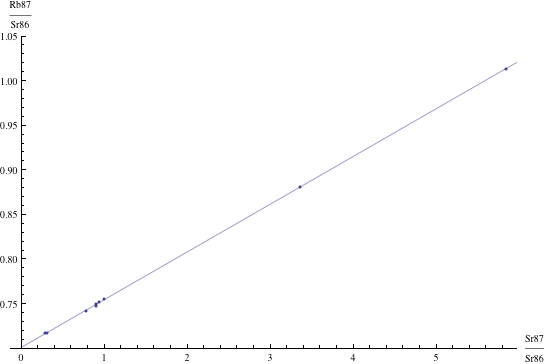
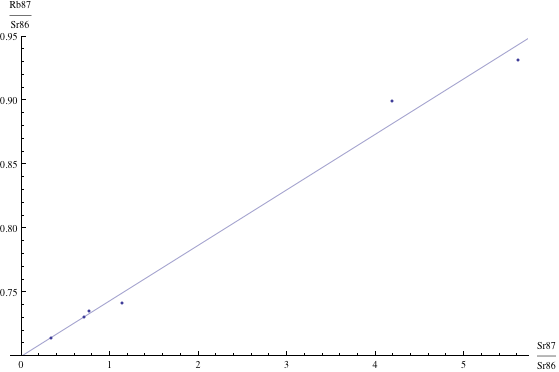
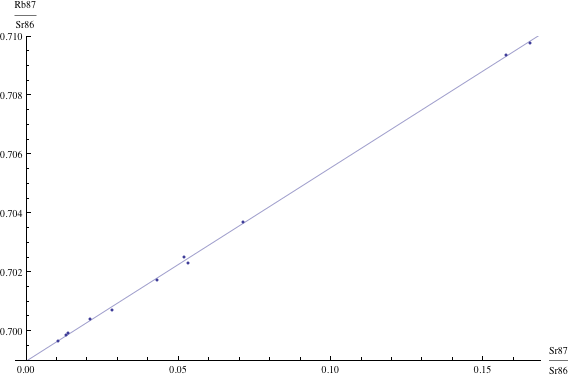
Here are just four examples of isochron graphs, which are entirely typical among the tens of thousands of examples that could be mentioned. Note how breathtakingly close these points are to the fitted lines (thus confirming with high statistical confidence the validity of the resulting dates):


The data for the first graph (upper left) is a set of measurements of basaltic achondrites (meteorites) in [Basaltic1981, pg. 938]; the data for the second graph (upper right) is from early Archaean gneisses rocks near Isua, Greenland [Moorbath1977]; the data for the third graph (lower left) is from ancient gneiss rocks in Swaziland [Carlson1983]; the data for the fourth graph (lower right) is from lunar dunite rocks gathered during Apollo 17 [Papanastassiou1975]. The corresponding dates obtained from these isochrons (based on the slopes of the lines), together with statistical standard deviations, are: 4.396 ± 0.18, 3.673 ± 0.014, 2.991 ± 0.15, and 4.478 ± 0.034 (each figure is in billions of years). See also [Dalrymple1991, pg. 149, 185, 248, 328].
For many years, fairly large samples were required to produce statistically reliable results. But with the advent of mass spectrometry beginning in the 1970s, even very small samples can now be accurately dated. For example, the “SHRIMP” ion microprobe now in use in numerous laboratories around the world can reliably measure U-Pb and Pb-Pb ages from spots only 0.02 mm (i.e., 20 micrometers) in size within a zircon crystal [Dalrymple2004, pg. 60-62].
Applications of radiometric dating
One interesting and timely application of advanced radiometric dating techniques in paleontology is in attempts to disentangle a controversy as to whether or not all dinosaurs (and numerous other species) were extinguished by a giant meteorite impact at a spot just north of the present-day Yucatan Peninsula. In 2011, researchers at the University of Alberta in Canada used the uranium-lead method to date a fossilized dinosaur bone found in New Mexico to be approximately 64.8 million years old. At the time, the Cretaceous-Tertiary meteorite impact was thought to have occurred approximately 65.5 million years ago. This suggested that hadrosaurs such as the researcher’s specimen may have survived for roughly 700,000 years after the meteorite event [SD2011b]. But in February 2013, a team of researchers at U.C. Berkeley, using a state-of-the-art argon-argon scheme that permits a significantly more accurate date determination, found that the impact had occurred 66,038,000 years ago, while the mass extinction occurred 66,043,000 years ago. Given that these dates differ by no more than the statistical error bars of the measurements (11,000 years), they are essentially identical. Thus these new findings offer dramatic confirmation to the theory that the meteorite impact caused the extinction (although climate-related phenomena prior to that time may have exacerbated stress on these species) [Sanders2013a].
In February 2014, a similar study was completed of the Permian-Triassic boundary, which marks the largest mass extinction in the past 500 million years. By employing some new uranium-lead dating techniques on specimens taken in China, they were able to establish that the extinction occurred between 251.941 million years (plus or minus 37,000 years) and 251.880 million years (plus or minus 31,000 years), meaning that the extinction took less than about 60,000 years (an eye blink in geological time), thus laying to rest the hypothesis proposed by some that this was a gradual event spanning hundreds of thousands of years [Zimmer2014a].
Another ongoing debate is whether or not Neanderthals persisted in Europe until after humans arrived. In June 2012, researchers announced that some red handprints and dots in a cave in northwestern Spain are more than 40,000 years old, based on a uranium-thorium dating of the calcite covering of the specimens. These results raised the intriguing possibility that the artists who created these images were Neanderthal, since at the time Neanderthals were thought to have remained in the Iberian peninsula region until as recently as 35,000 to 40,000 years ago [Wilford2012]. However, in February 2013 researchers at the University of Oxford in the U.K, using a more sophisticated Carbon-14-based dating process, found that the latest Neanderthal sites are 10,000 years older than previously thought — i.e., they are 45,000 to 50,000 years old. Thus, for example, the handprints in Spain most likely are human, not Neanderthal [Callaway2013].
Reliability of radiometric dating
The reliability of radiometric dating is discussed in detail in the following article on this site: Reliability. Another related article discusses radiocarbon dating: Radiocarbon dating.
Conclusion
The general picture of a 4.56-billion-year-old Earth, with fossils spanning many millions of years, is well beyond any reasonable doubt. Indeed, the young-earth worldview that the early is only a few thousand years old has not been scientifically defensible for at least 50 years (some would say 100 years). Such a view is no more credible at this point in time than is the ancient cosmological picture of the sun, planets and stars revolving around the Earth at heights of a few thousand feet — both reckonings are off by factors of millions and billions from very-well-established scientific findings.
Some valuable (and generally quite readable) references on radiometric dating, including detailed responses to specific issues that have raised by creationists, are the following: Dalrymple1991; Dalrymple2004; Dalrymple2006; Isaak2007, pg. 143-157; Miller1999, pg. 66-80; Stassen2005; Radiometric2013; Stassen1998; Wiens2002].